For the last few months, I’ve been thinking about hand-painting a data visualization.
I love hand-drawn charts – historical maps, the Dear Data postcards, and even the pencil sketches people make before jumping into Illustrator or D3. In the undergrad data visualization course that I teach, I make the students hand-draw all their charts for the first few weeks. Those charts are the most innovative, soulful charts I see all semester.
I love hand-drawn charts because the process forces us to decide what we want to show in the data because we don’t have a computer to make decisions for us; all we have is pen and paper. In that spirit, I try to start every data viz project with hand-drawn sketches so I’m not confined by whatever tools I’m using.


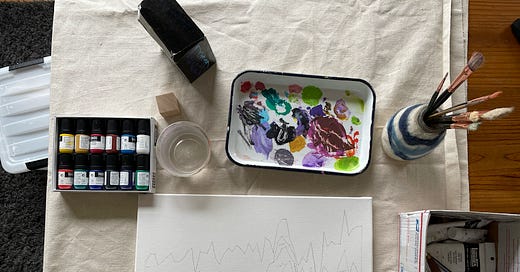
A few weeks ago, I decided to take this one step further by painting a data visualization on a large canvas. I decided to visualize the history of my hometown baseball team, the Kansas City Royals, by showing how much the best players have contributed to the team’s success. (For you baseball nerds: I looked at the top-20 players in franchise history by WAR.)
I wanted to fully hand-draw the entire streamgraph chart (which is the kind of chart you see below). But my first attempts at drawing an accurate streamgraph were bad. So I used D3 to make the streamgraph instead:
If I were designing this chart to purely get across the information, it would have looked different. But I wanted the chart to be visually interesting as a piece of wall art; I wanted people to walk up to it and study the names. So I arranged the data so it would produce interesting shapes.
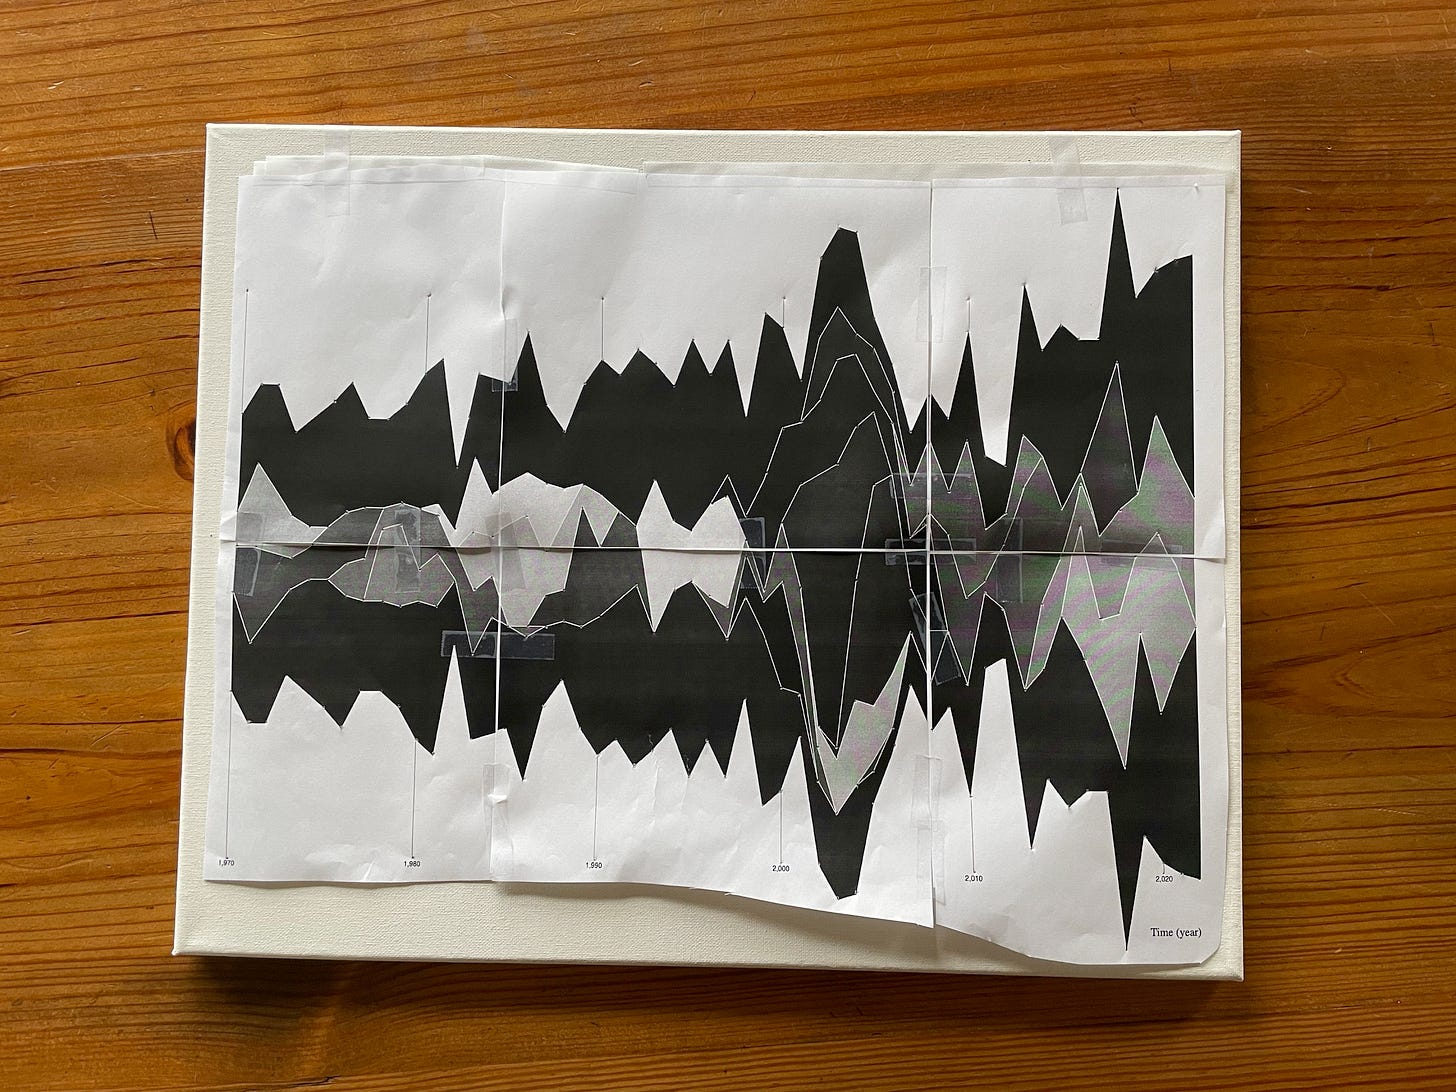
I took a screenshot of the chart and brought it into Illustrator. I was painting on a 20-inch by 16-inch canvas, so I made an artboard that size and I printed the visualization onto six standard pieces of computer paper. In Illustrator, you can do that in the print options by scaling the image to “Tile Full Pages”. Notably, I gave each piece of paper a 20px overlap since the printer can’t print right up to the edges.
From there, I cut the data viz and taped the papers together. Then I put it on the canvas:
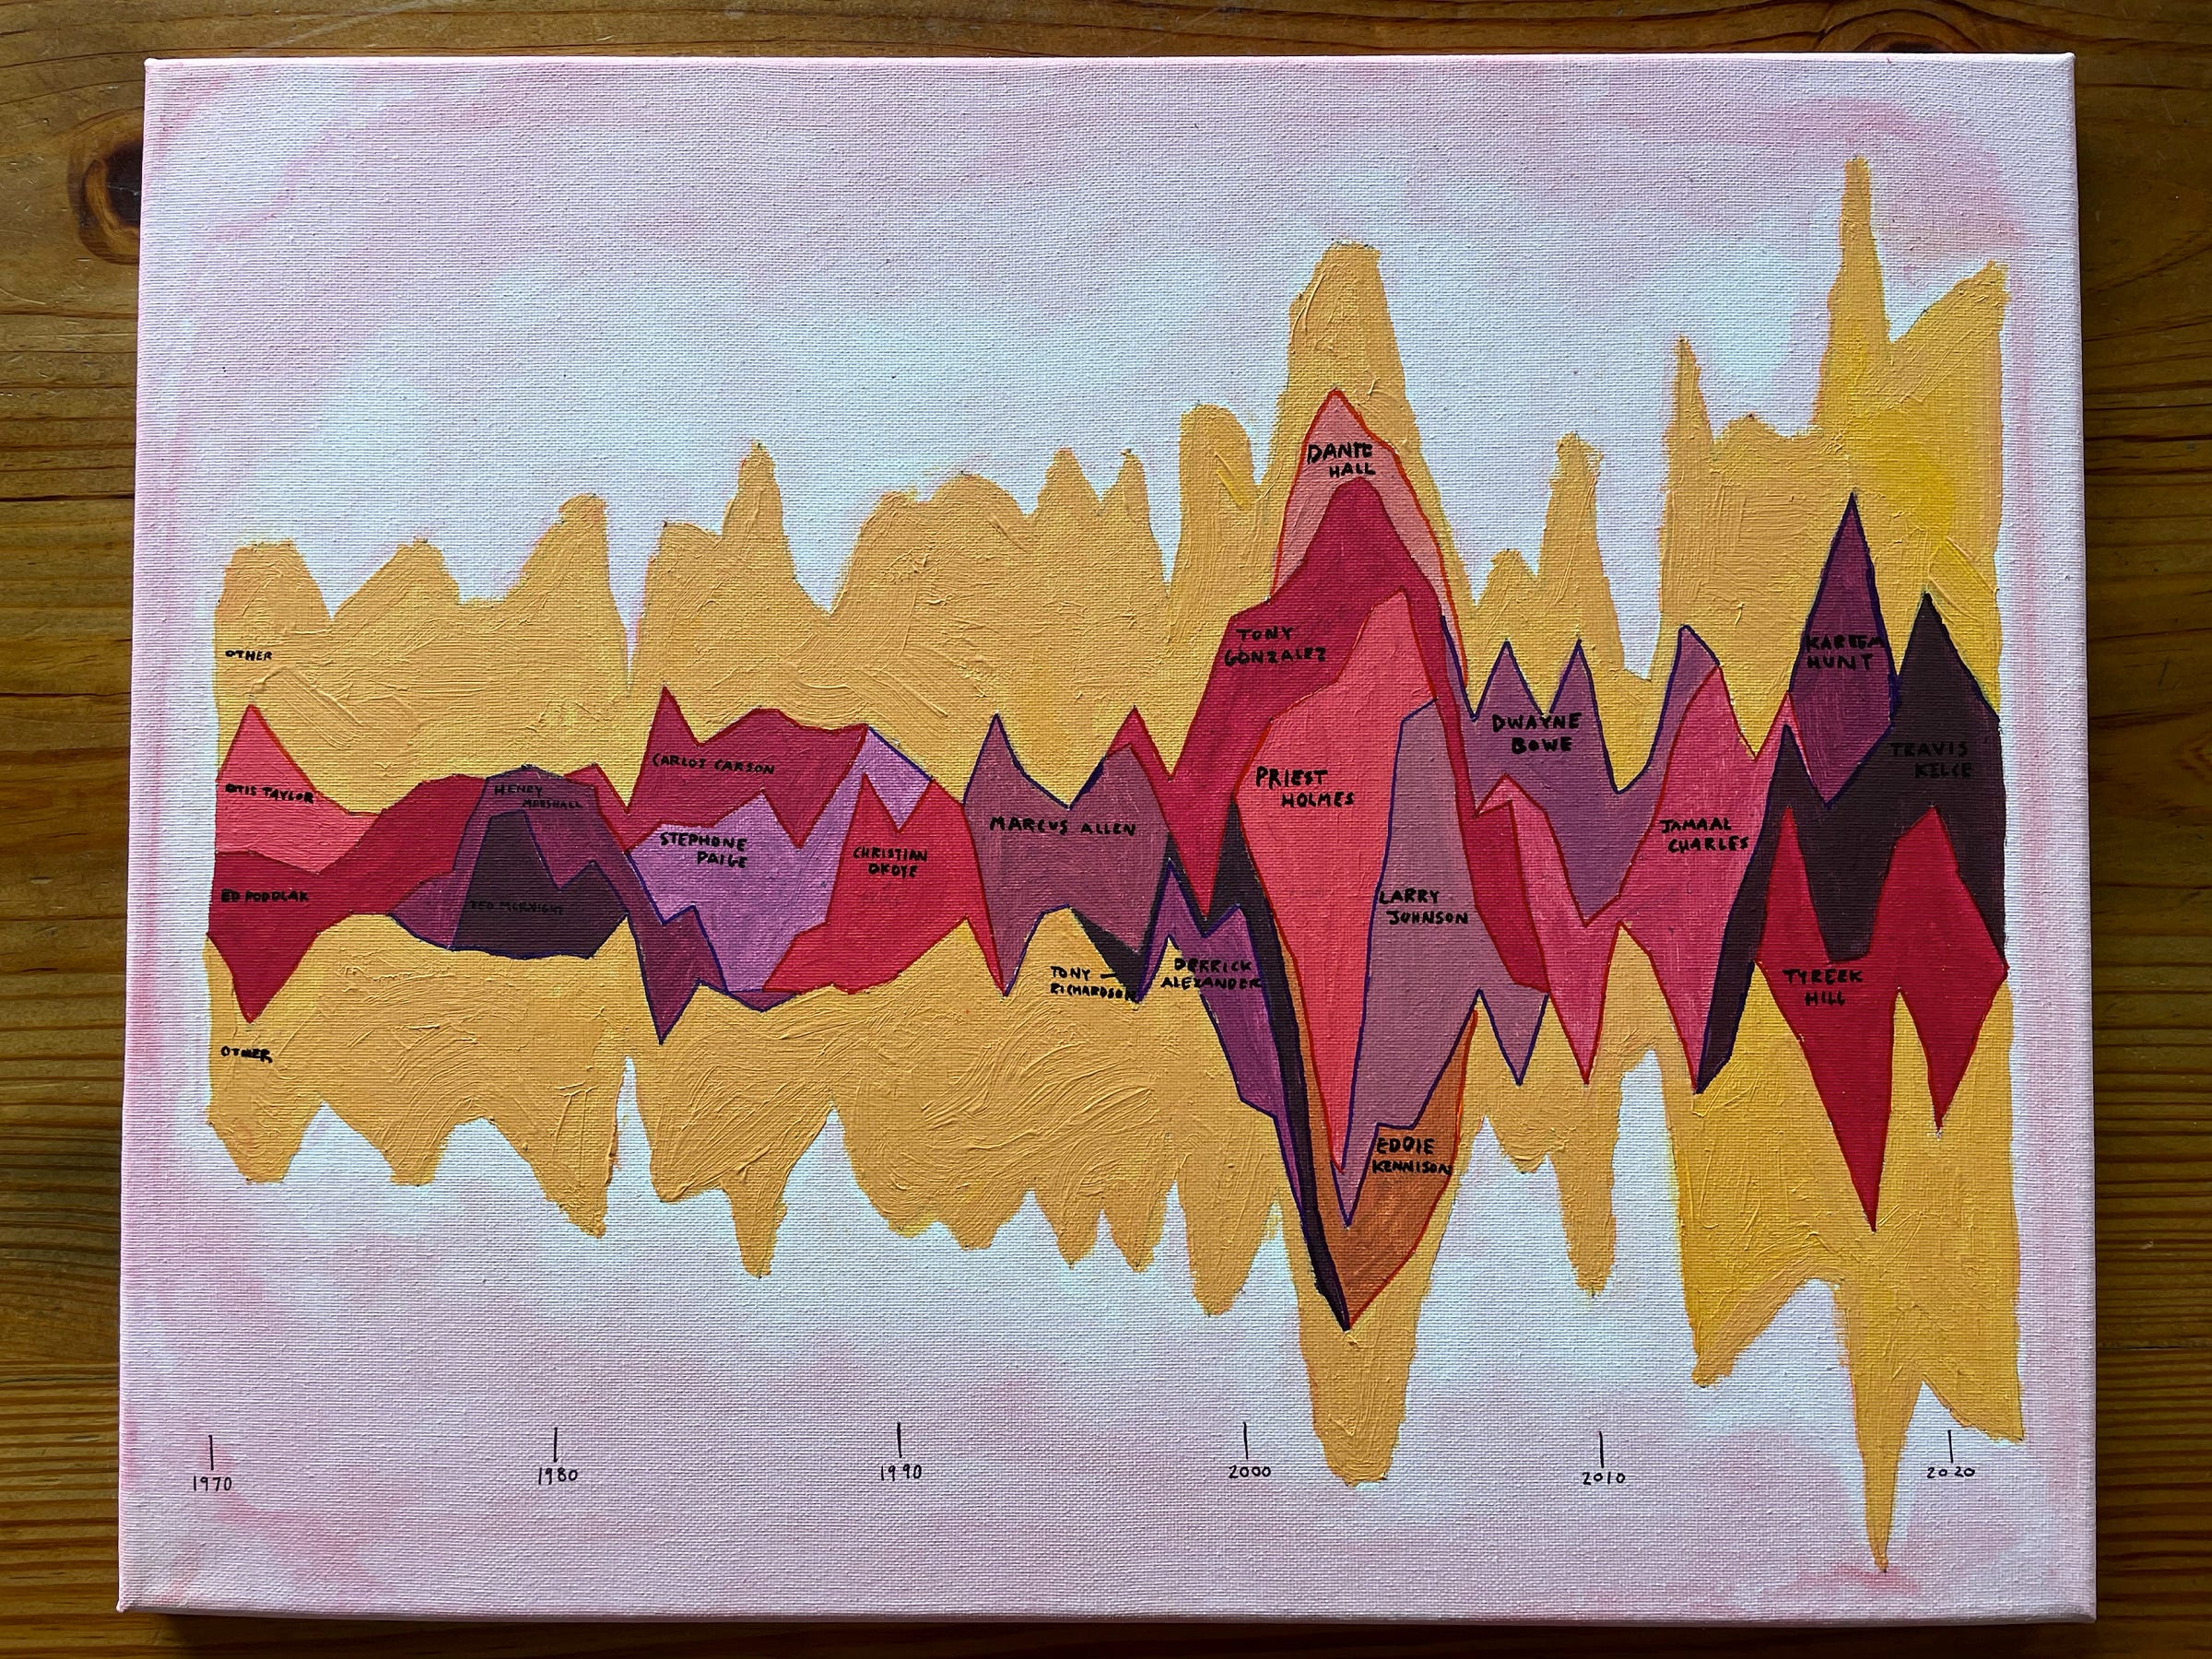
(One huge side note: While I was doing this, I was stressing out about getting my brother a birthday gift. He’s not a Royals fan, but he likes football and he loves the Kansas City Chiefs. So I decided to pivot and make a Chiefs data viz for his birthday. I visualized how many touchdown the team’s best players contributed to each season.)
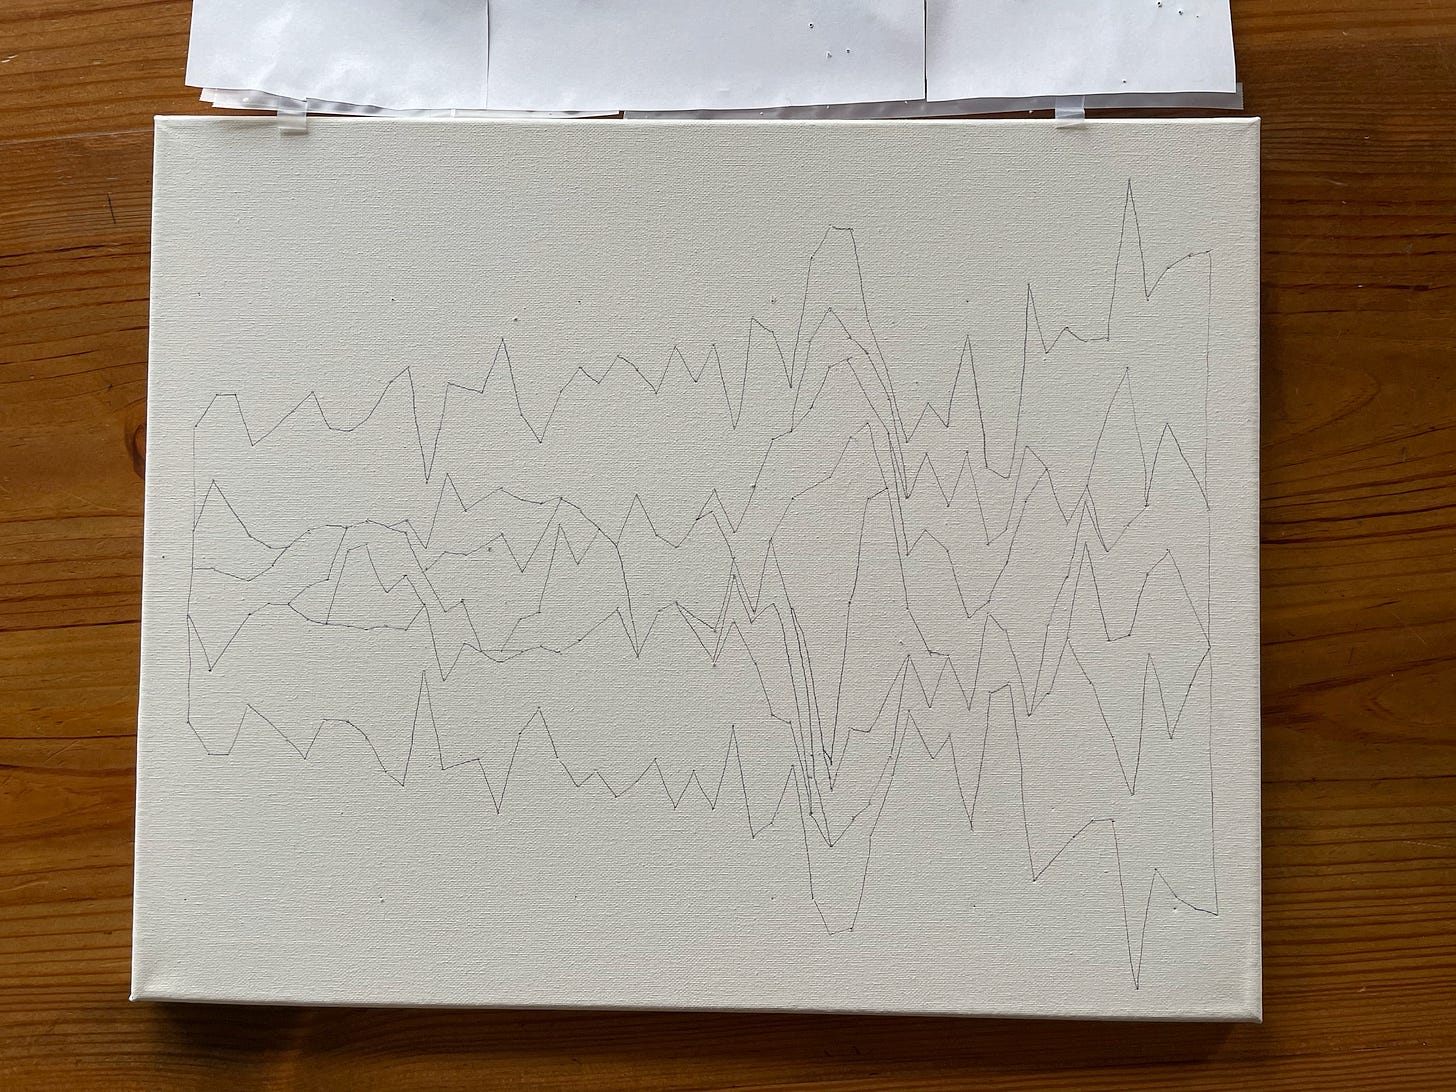
Sketching it onto the canvas was difficult. I ended up taking a pointy pen and poking holes through the paper so I could see where the lines were. That took a long time.
Eventually I had something that looked like this:
I went back to my D3 interactive so I could figure out which player each section represented. And then I got to painting.
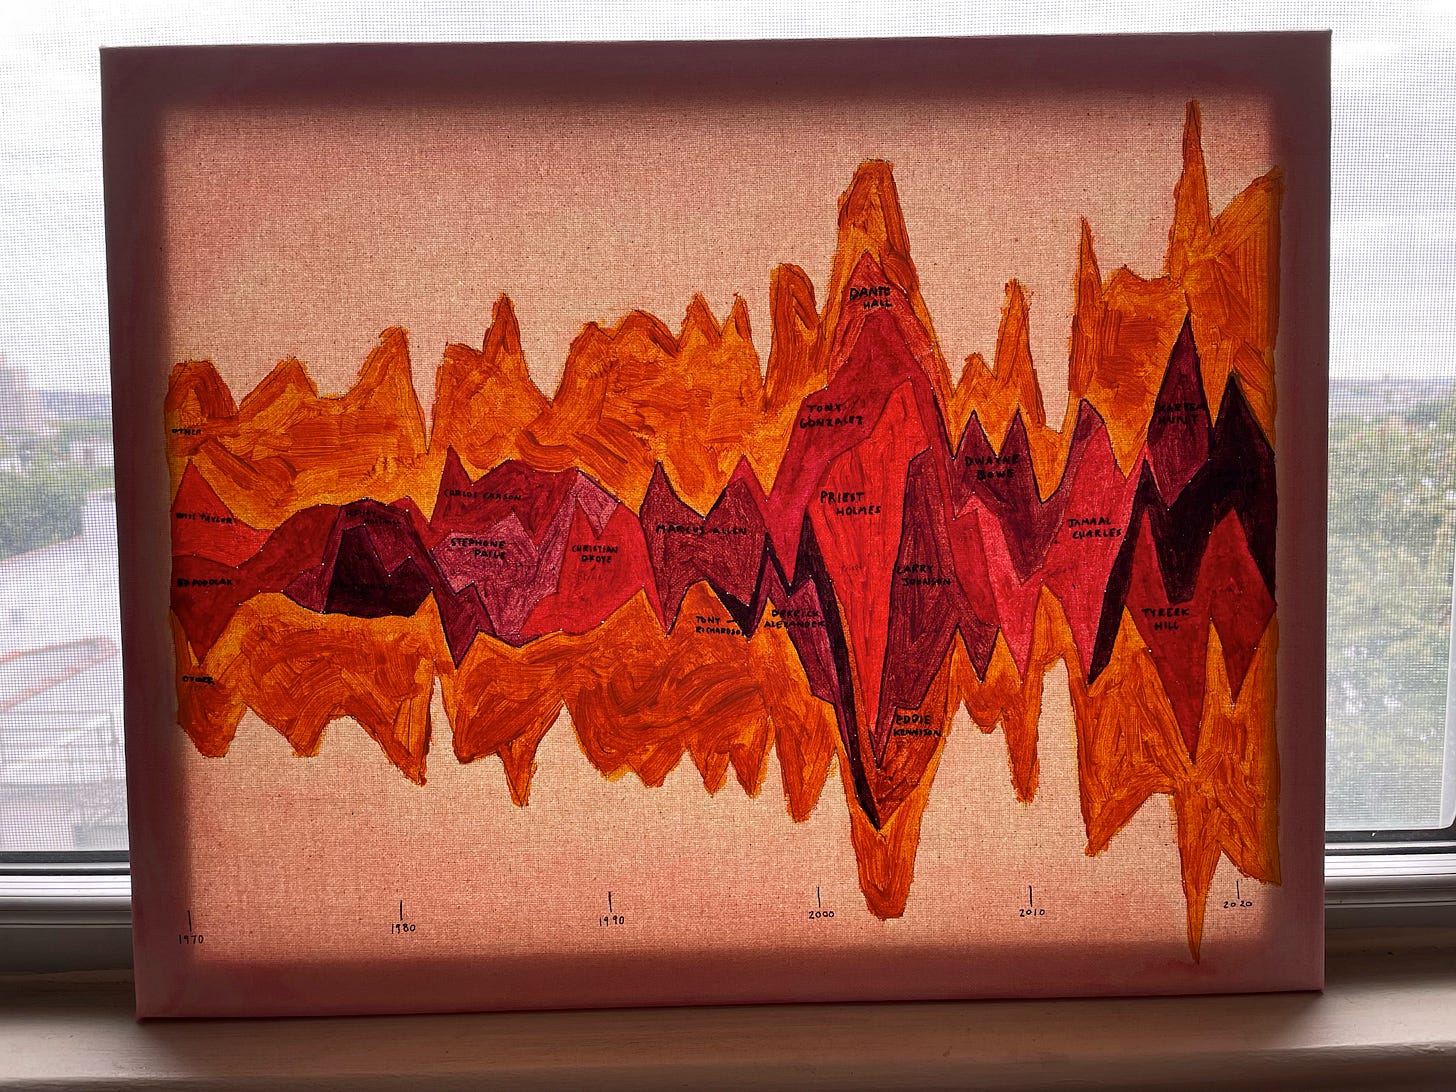
I really enjoyed how long it took to paint each section. My brother and I grew up in Kansas, so seeing these names – Marcus Allen, Priest Holmes, Dante Hall – brought up so many memories. It ends on the far right with Travis Kelce, who apparently has a new girlfriend.
Anyway, I was pretty happy with the result. My brother seemed pretty happy with it, too:
Halfway through making the piece, I thought it should be displayed in a window like stained-glass art. I ditched that idea, but maybe I’ll revisit it in the future:
I’ll probably finish up my Royals streamgraph at some point. But if I make more data viz paintings (and I want to), I’m going to draw the data viz by hand rather than generating it out in D3. That probably means I won’t be making a streamgraph, but it opens up so many more possibilities.
The ultimate goal is to make a huge data viz painting – one that you can study for hours. It’s the kind of data viz that we don’t make anymore, largely because we’re designing for small screens rather than huge walls.
All this is to say, I’m smitten by the idea of painting data viz and you’ll see more of it soon.





It's a great idea, and I totally get what you mean when you talk about the connection you have with the data and the memories it brings up as you make it. I like to think that some echoes of that live in the piece even when other people view it. When they see your brushstrokes, for instance, or when they read the hand-lettered names.
I once explored doing a stacked area graph using watercolours, because they go on translucent, allowing you to see the colours beneath. You've inspired me to try again.